Updated environmental indicators show the country’s greenhouse gas (GHG) emissions in 2019 showed no sustained reductions compared to 2005 levels but our glacier ice volumes are continuing to decrease, Stats NZ reports.
The indicator ‘greenhouse gas emissions’ measures New Zealand’s GHG emissions from 1990 to 2019, showing the trends for emissions, quantities of different types of emissions, and their main sources.
In 2019 New Zealand’s gross greenhouse gas emissions were 82.3 million tonnes of CO2-e, 0.2% lower than 2005 and 26.4% higher than 1990. Emissions were 2.2% higher than 2018.
Gross GHG emissions were mainly made up of carbon dioxide (45.5%), methane (42.1%), and nitrous oxide (10.2%).
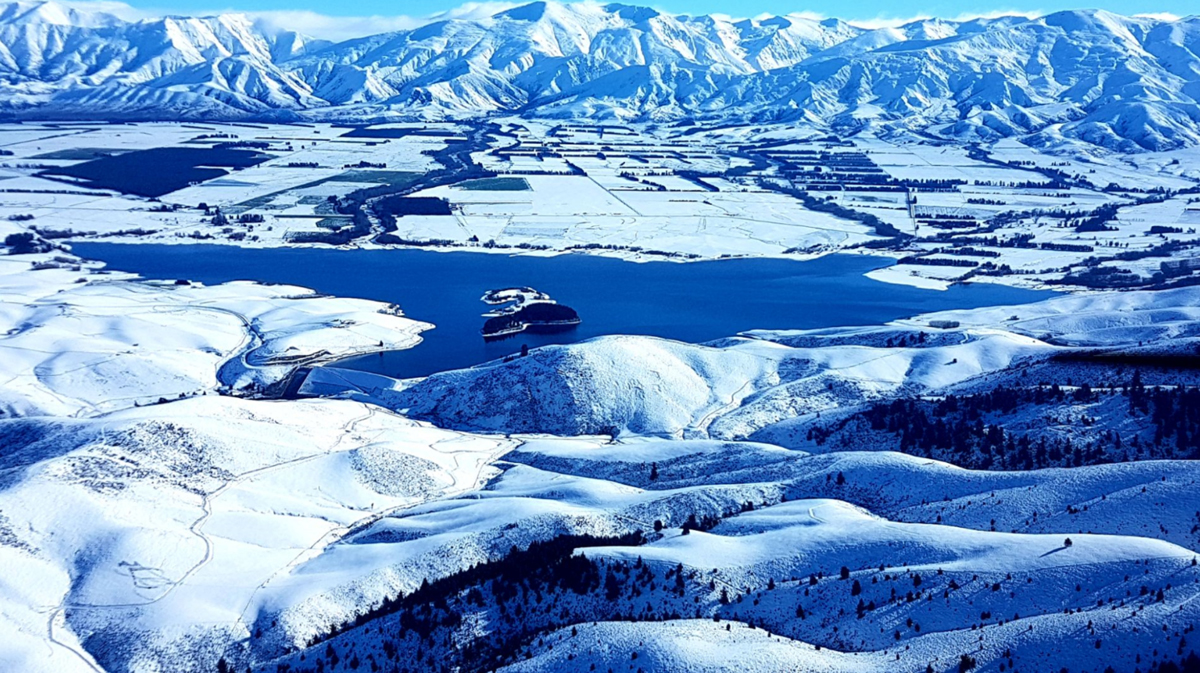
The indicator ‘annual glacier ice volumes’ shows a 35% decrease of the ice volume in our glaciers from 1978 to 2020, down from 53.3 km3 to 34.6km3. The highest three losses are in the last 10 years, indicating glaciers are being lost more rapidly.
The greatest annual losses in glacier volume were in 2011 (2.5km3), 2018 (2.7km3), and 2019 (2.5km3).
These indicators are part of a larger tranche which will inform the Ministry for the Environment and Stats NZ’s report ‘Environment Aotearoa 2022’ which is to be released in April this year.
New Zealand’s share of global GHG emissions is small, but our gross emissions per person are high.
New Zealand has several domestic and international greenhouse gas emissions reduction targets (see Greenhouse gas emissions targets and reporting).
Carbon dioxide emissions in 2019 were mainly produced by transport (42.9%), manufacturing industries and construction (20.0%), and public electricity and heat production (11.1%).
Gross methane emissions were mainly produced by livestock (88.4%). Methane emissions from livestock in 2019 were up 9.0% from 1990 and down 1.6% from 2005. They were up 0.3% from 2018.
Livestock methane emissions in 2019 were mainly produced by cattle digestion (65.1%) and sheep digestion (27.9%).
Gross nitrous oxide emissions mostly came from agricultural soils (92.8%), at least half (50.2%) of which was from urine and dung deposited by grazing animals. Overall, nitrous oxide emissions were up 45.3% from 1990 and up 5.9% from 2005. They were up 0.4% from 2018. Nitrous oxide made up 19.9% of all agriculture emissions in 2019.
Fluorinated gases contributed only 2.2% to gross greenhouse gas emissions, but their emissions have been growing rapidly. While 2019 emissions from fluorinated gases were 4.6% lower than 2018, they were 97.7% higher than 1990, and 133.1% higher than 2005.
New Zealand’s net greenhouse gas emissions were 54.9 million tonnes, 33.5% higher than 1990 due to the underlying increase in gross emissions, and 4.0% lower than 2005.
The total amount of greenhouse gas emissions removed by forest land in New Zealand ranged between 21.1 million and 36.8 million tonnes over the period 1990 to 2019. In 2019 net GHG emissions were 2.0% higher than 2018.
- The greenhouse gases data (HERE) come from the Ministry for the Environment.
Related indicators
Global greenhouse gas emissions
Source: Stats NZ


